Normal Curves
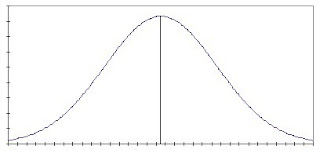
"Normal curves" are a particular type of density curve that describe a particular type of distribution. They are symmetric, single peaked, and bell-shaped as this diagram shows.

The mean of a normal curve is the same as its median.
The type of distribution that is described by a normal curve is called a "normal distribution" and is encountered very often when examining data. The normal curve has known properties which we can use to obtain information about a normal distribution.
Normal curves can be described entirely by their mean and standard deviation.
The mean is the middle point of the curve (represented by the vertical line in the middle of the diagram.)
The standard deviation is the distance of the turning points of the curve to either side of the mean. The turning points are the points on either side where the curve changes from becoming more steep to becoming less steep. They are roughly marked in the diagram below.

For this reason, normal curves are often described by the notation N(µ, σ)
Approximately 68% of the area under a normal curve lies between the points µ- σ and µ+ σ (the turning points.)
Approximately 95% of the area under a normal curve lies between the points 2µ- σ and 2µ+ σ.
Approximately 99.7% of the area under a normal curve lies between the points 3µ- σ and 3µ+ σ.
Continue to next section: Standardising


1 Comments:
Thanks! A very nice summary of normal curve. Especially the relationship between mean and standard deviation with the curve.
Post a Comment
<< Home