Time Plots
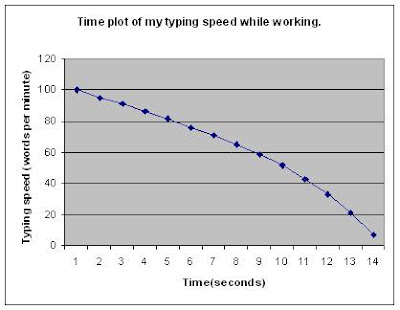
Time plots are used to display the change in a variable over time.
The value of the variable is plotted at constant intervals over time, then the plotted points are connected by lines.


Time plots are used to display the change in a variable over time.

0 Comments:
Post a Comment
<< Home