Confidence Intervals for Population Means
Confidence intervals are a type of statistical inference where we create an interval using data from a sample and estimate the probability that some population parameter is found within (captured by) that interval.
Intervals are often described in the form "the interval a ± b" (which means the interval from a - b to a + b.)
A level C confidence interval for a parameter is an interval which has a C percent chance of capturing that parameter.
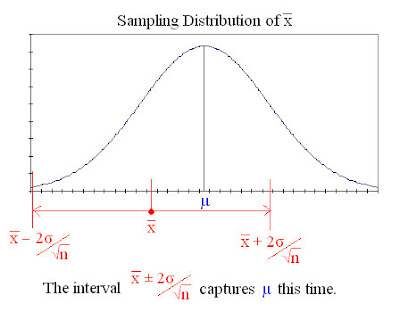
We know that the sampling distribution of x is normal for a population whose distribution is normal, so we know that 95% of the possible values of x lie within 2 standard deviations (2 times σ/√n) of its mean (µ). Thus if we obtain an x from a sample, we can be 95% sure that the value of µ is somewhere between x - 2σ/√n and x + 2σ/√n.
The interval x ± 2σ/√n is a 95% confidence interval for µ. The image below shows this confidence interval around a particular x successfully capturing the mean.

Constructing a Confidence Interval for µ
Known σ
A level C confidence interval for the mean of a normal population (µ) is given by:
x ± z*σ/√n
Where z* is called a "critical value", and is the distance to either side of the mean between which lies C% of the area under the standard normal curve. To find the value of z* for a particular C, use software or a table of z* critical values (below).
(click image for full size version)

e.g. If we want to construct a 95% confidence interval, the value of z* we use is 1.960 (from the table.)
Unknown σ
Usually we don't know the population standard deviation(σ) and thus don't know σ/√n. Instead we have to estimate σ/√n using our sample's standard deviation (s). To do this we use s/√n instead of σ/√n.
The standard deviation of x when estimated from the standard deviation of the sample(s) is called the standard error(SE).
Unfortunately, it's not so simple.
Standardising x using σ/√n gives z, which has the standard Normal distribution, however, standardising x using s/√n gives a different result, t, which has the t(n-1) distribution.
Because the distribution of standardised x using s/√n is not Normal, we cannot use z* to create the interval. Instead with have to use t*, the critical value for the t(n-1) distribution curve.
There are many different t-curves, each with slightly different shapes. These curves are distinguished by a parameter called their "degrees of freedom"(df)
The degrees of freedom is usually marked in brackets next to the t, as with the t(n-1) above. t* can be calculated using software or from a table of t* critical values (below.)
(click image for full size version)

e.g. If our sample size is 30, and we want a 95% confidence interval, then to find t* using the table of t* critical values:
Find the degrees of freedom
df = 30 - 1 = 29
Find the row whose value in the df column is 29.
Then go across that row until we reach the 95% column, and we have our t* value: 2.045
In summary:
A level C confidence interval is given by
x ± t*s/√n
Using the t* value with degrees of freedom(df) n-1 and confidence level C.
As a rough guide for when it's safe to use this t-procedure, use the guidelines for one-sample t-procedures


0 Comments:
Post a Comment
<< Home